
The mean trap: mistaking a KPI number for a target actually met
A look at the distortion that creeps in when a KPI is managed by a single mean value, through real cases of quote lead time and on-time delivery rate, and how to read data properly.
Hi, this is Rabbit! 🐰
It was during a month-end report. I tallied up the quote completion time KPI and got an average of 6.0 days. The target was 5 days — target missed. But digging into the data case by case: case A took 3 days, B took 4, C took 5, D took 4 — all fine so far. The problem was case E, the one that needed external material procurement, which took 14 days.
A case that has to wait on an external vendor’s quote is a variable we have no control over. Does an average that includes that one case, and comes in over target, really mean there’s a process problem? That question is where I started looking at the mean differently.
- The mean is a statistic that can swing wildly on the strength of a single outlier.
- What looks like an outlier might actually belong to a different population entirely.
- Before asking whether a KPI number hit its target, ask what that number actually contains.
Why the mean swings the way it does
The mean (arithmetic average) is every value added up and divided by the count. It’s intuitive and easy to calculate, which is why it’s the most common KPI metric — but it has one fatal weakness: it’s sensitive to extreme values.
Back to the example above: the mean of 3, 4, 5, 4, 14 is 6.0. Drop the 14, and it becomes 4.0. One value pulled the overall mean up by a full 2 days. Even though 80% of the data fell within target, the KPI still got logged as a miss.
The mean treats every member of the group equally. The 14-day external procurement case and the 3-day case are weighted exactly the same.
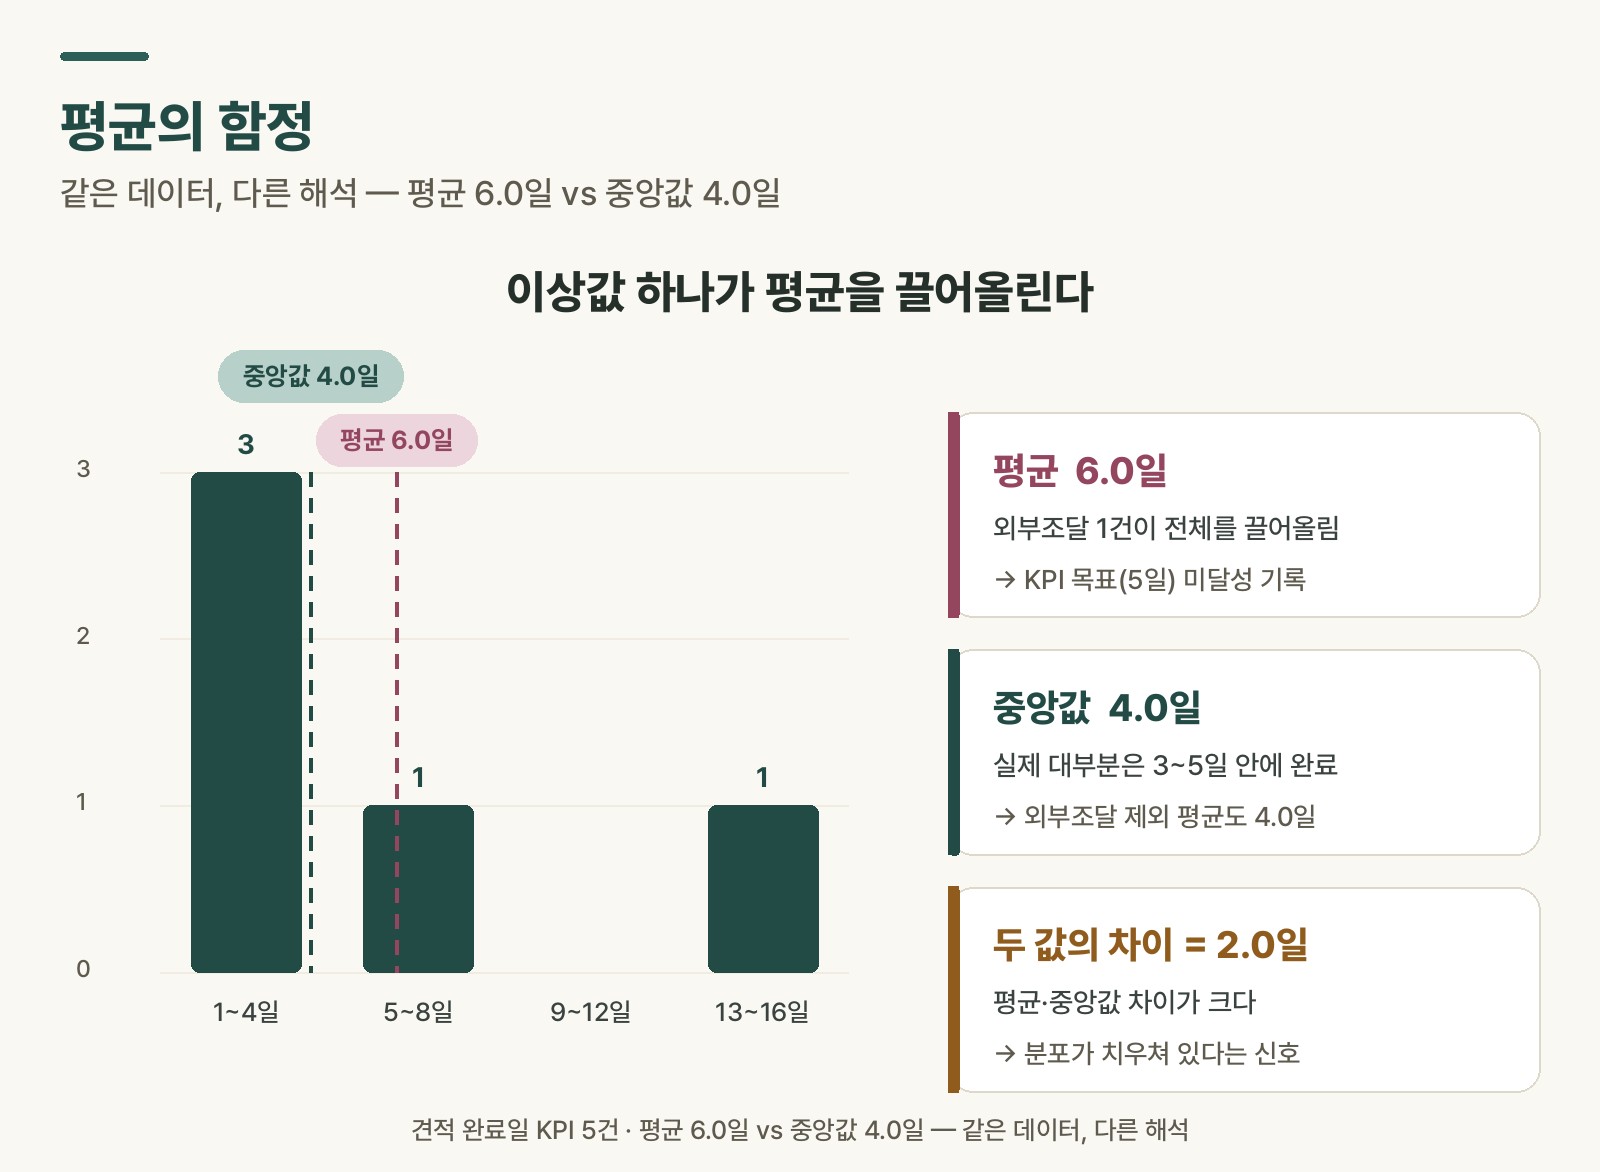 Figure 1. Mean of 6.0 days (KPI missed) with external procurement included vs. 4.0 days (KPI met) excluded
Is it an outlier, or a different population
Should we just treat the 14-day case E as an outlier and remove it? Removing outliers is a legitimate way to clean up data in statistics. But before removing anything, there’s a question worth asking first.
“Is this value a measurement error or a random fluke — or is it structurally a different kind of data altogether?”
A quote that requires external materials was never going to be completed by internal process alone in the first place. The external vendor’s response time and material availability directly affect the lead time. This isn’t an outlier — it’s a different population.
💡 Key point: Removing outliers applies to “a value that stands out within the same population.” If the data is a genuinely different kind of case from the start, the right move is to separate it out and track it as its own KPI, not remove it.
That’s the call we made in practice. We started tallying quotes involving external procurement separately, and measuring the KPI based only on quotes completed entirely through internal process. That way, both groups become meaningful data — the external procurement cases can be tracked on their own terms too, for vendor response speed or supply lead time.
Another way data gets contaminated
A similar problem shows up with on-time delivery rate. On-time delivery rate measures whether a product was completed by its promised delivery date. But here’s what happens on the floor sometimes:
Mid-production, a process gets put on hold at the customer’s request. It’s set to resume a week later, but the salesperson never updates the delivery date in the system. The product finishes a week later than the original date, and the system logs it as a late delivery.
In reality, the delay was caused by a hold the customer themselves requested — but in the data, it gets recorded as our fault. When the on-time delivery rate gets tallied, this case is naturally counted as a miss. This isn’t an outlier, and it isn’t a different population. The data itself is contaminated. Before analyzing the cause statistically, you first need to check whether the record itself even reflects reality.
No matter how well you process numbers statistically, if the input data doesn’t reflect reality, the analysis is broken from the start. There’s a saying: “Garbage in, garbage out.” Take an average, look at a median, plot a distribution — without data quality secured first, whatever judgment you draw from the result is garbage too.
⚠️ Note: Before trusting a mean, first check whether the data behind that number was recorded correctly. Statistical processing is a step that comes after data quality is secured, not before.
So how should you actually look at it
This isn’t an argument for abandoning the mean in favor of some other metric. It’s an argument for using the mean while also looking at what data built that number.
A few practical approaches:
First, split the groups first. Don’t lump cases of different character together and average them. Separate external procurement cases from internally completed cases, cases with a customer hold from those without, and tally each on its own.
Second, look at the median alongside it. The median (median) is the middle value when all the data is sorted in order. It’s barely affected by extreme values. Sort 3, 4, 4, 5, 14 in ascending order: 3, 4, 4, 5, 14 — the middle value is 4. The mean is 6.0, the median is 4.0. When the two diverge this much, it’s a signal the distribution is heavily skewed. Looking at the mean alone makes it look like “a 6-day process,” when in reality most cases wrap up around 4 days.
Third, check the distribution. Look at how the values are spread — descriptive statistics like minimum, maximum, and quartiles, or a histogram if you can. Things that stay hidden when everything is compressed into one mean value show up once you look at the distribution.
Fourth, set data entry standards. A process for always updating the system delivery date when a delay request comes in, a field that distinguishes external procurement cases — without standards like these, data piles up but becomes unusable.
Rabbit’s Takeaway
The first thing I learned in my statistics class was mean and variance. But when you actually deal with KPIs at work, a much more basic question comes up before any of that: “can I trust this number?”
The mean isn’t a bad metric. The problem starts when you try to make one mean value explain everything. Reading data properly, I think, starts less with calculating a number and more with the habit of asking what that number contains — and what it’s hiding.
Something I’ve come to realize while studying statistics again: what’s needed before any formula is the instinct to ask “does this data actually reflect reality?” And that question was one I’d already been asking on the floor, outside any textbook. I’m just now putting it into words.
Next time a number tells you a KPI’s been hit, pause for a second and ask again: “is this mean actually telling the truth?” 😎
Read more