
Correlation is not causation: what data tells you, and what it doesn't
From the meaning of the correlation coefficient r to the difference between correlation and causation and common mistakes made in practice — a statistics concept note.
Hi, this is Rabbit! 🐰
“The shorter the lead time, the higher the defect rate.” Pull the data, and sure enough, that pattern shows up. So does extending the lead time reduce defects?
Probably not. If short-lead-time periods are also the busiest periods — when order volume spikes — and defects also rise when things get busy, then lead time and defects look related, but lead time isn’t the cause of the defects. Both are actually being driven by a third factor: “being busy.”
This is the difference between correlation and causation.
- Correlation is a tendency for two variables to move together. It is not cause-and-effect.
- The correlation coefficient r, ranging from −1 to +1, expresses the direction and strength of a relationship as a number.
- Correlation often exists without causation. Knowing what the data doesn’t tell you matters just as much.
What is correlation
A tendency for two variables to move together is called correlation.
- Positive correlation: as A increases, B tends to increase too. Production volume and power consumption.
- Negative correlation: as A increases, B tends to decrease. Inventory level and order frequency.
- No correlation: no clear tendency between A and B.
The key word is “tendency.” Correlation isn’t an exceptionless law — it means there’s a general tendency to move together.
Correlation coefficient r — how strong is the link
The direction and strength of a correlation, expressed as a single number, is the correlation coefficient r. It ranges from −1 to +1.
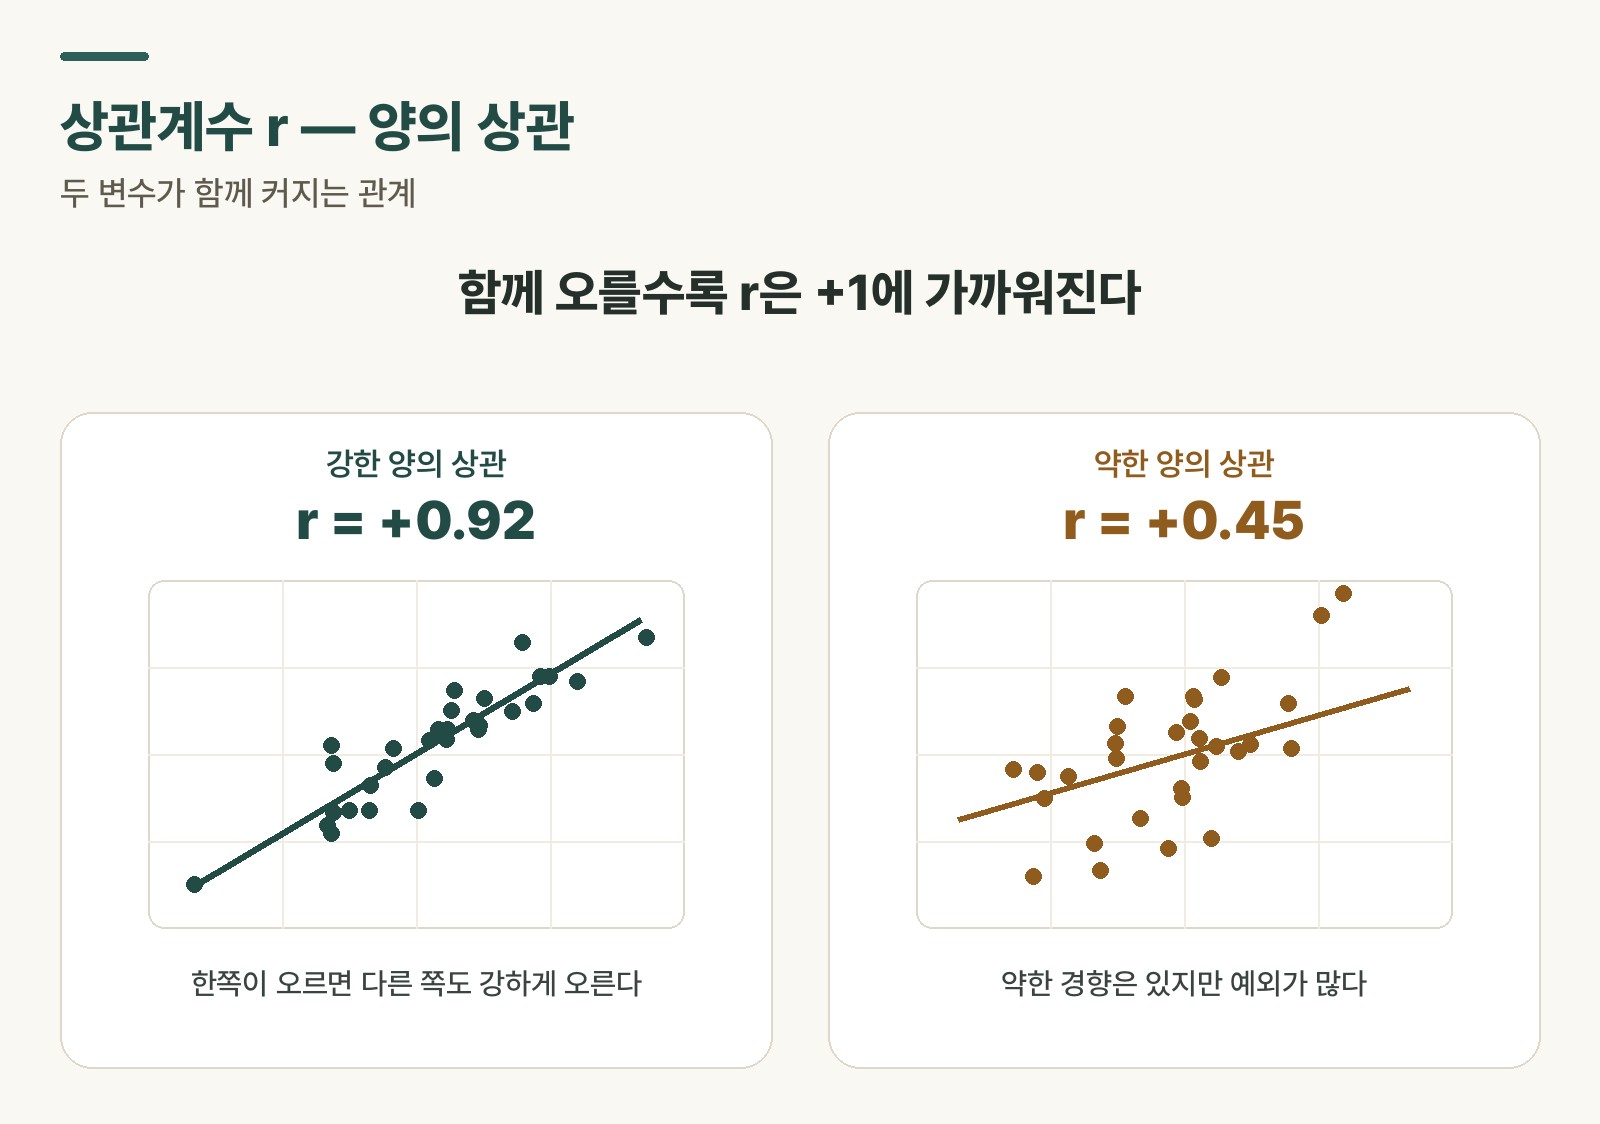 Figure 1. Positive correlation — the more they rise together, the closer r gets to +1 (left: strong, right: weak)
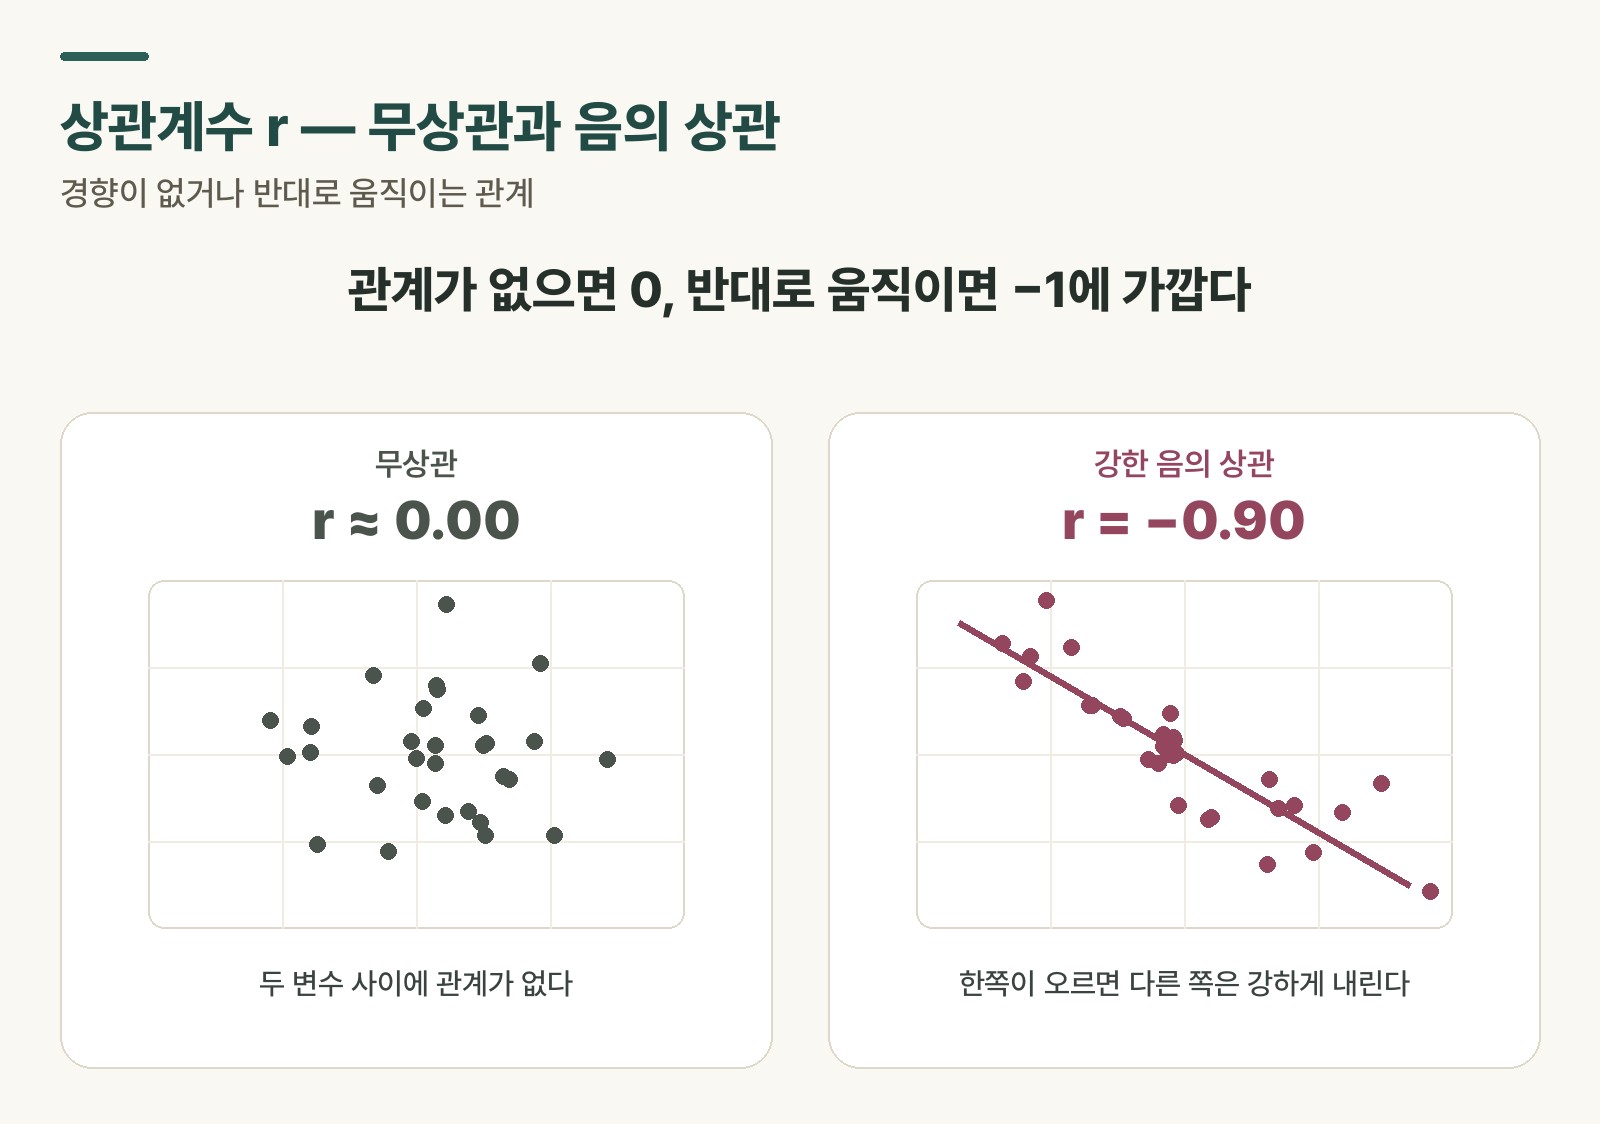 Figure 2. No correlation vs. negative correlation — 0 when there’s no relationship, near −1 when they move in opposite directions
Rough guidelines for interpreting r:
| r range | Interpretation |
|---|---|
| 0.9 or above | Very strong correlation |
| 0.7 – 0.9 | Strong correlation |
| 0.4 – 0.7 | Moderate correlation |
| 0.2 – 0.4 | Weak correlation |
| Below 0.2 | Essentially no correlation |
Table 1. Correlation coefficient r interpretation guide (absolute value; negative sign only flips direction)
A large r value does not mean there is a cause-and-effect relationship between the two variables. r only tells you direction and strength.
💡 Key point: r = +0.92 means “these two variables strongly move together.” No value of r, however high, can tell you “A causes B.”
How is this different from causation
When correlation exists without causation, it usually falls into one of three patterns.
First, reverse causation. It’s not A → B, but B → A. “Shorter lead times lead to more rework” might look true, but the real story could be that heavy rework is what compressed the lead time in the first place. The direction is flipped.
Second, a third variable (confounder). There’s some factor C that influences both A and B. The lead-time-and-defects example from the intro fits here: “being a busy period” (C) moves both lead time (A) and defect rate (B). A isn’t causing B.
Third, coincidence. With enough data, a high r can show up between two variables that have no real relationship at all. This happens especially often with time-series data — if both variables happen to trend upward over time, even completely unrelated variables can produce a high r.
⚠️ Note: A high correlation should never be the sole basis for deciding on an intervention — extending lead times, cutting inventory, and so on. An intervention based on unverified causation can have no effect, or even backfire.
Patterns that trip people up in practice
Two common misreadings that show up in production floor data.
Correlation between output volume and defect count — months with higher output also tend to have more defects, and r comes out fairly high. But that’s expected: with a larger base, the absolute defect count naturally rises too. What you should look at instead is the defect rate (defect count ÷ output volume). Switch to a ratio, and the correlation can disappear or even reverse.
Correlation between on-time delivery rate and overtime hours — months with more overtime can look like they have higher on-time rates. Reading this as “more overtime improves on-time delivery” is risky. If tight deadlines are what’s driving both the overtime and the barely-made deadlines, the direction of causation is entirely different.
When you spot a correlation in the data, the first question to ask is “why are these two variables moving together?”
In practice: once you’ve calculated an r value, don’t stop there — plot the scatter plot yourself. The same r can come from wildly different data distributions. A single outlier can shift r substantially. As covered in the descriptive statistics concept note, it’s a good habit to look at the whole distribution rather than trusting a single number.
So how do you actually check for causation
Statistics alone can’t prove causation. You need to look at all three of the following together.
Time-series ordering — check whether A changes first and B changes afterward. A cause has to precede its effect. If they move simultaneously, or B moves first, it isn’t causation.
Experimental design — check whether deliberately changing A produces a change in B. A full experiment is hard to run on the shop floor, but comparing across lines or time periods can offer partial verification.
Domain knowledge — in the end, this takes judgment from someone who knows the floor. Statistics can tell you “there appears to be a relationship.” Why it exists comes from experience on the ground.
Rabbit’s Takeaway
In a statistics class, learning the correlation coefficient tends to become an exercise in memorizing the formula. But in practice, what matters more than being able to calculate r is knowing “what this r value says, and what it doesn’t say.”
What the data says: two variables have a tendency to move together. What the data doesn’t say: why, which one is the cause, and whether intervening would even help.
Knowing that boundary clearly — that, I think, is the difference between someone who crunches data and someone who reads it. 😎
Read more